Show the code
---
title: Bugzilla Bug Edits
description: Bug edit trends.
date: 2025-10-12
---
{'title': 'Bugs Edited by Affiliation', 'refresh': 'weekly', 'onIndex': 0}---
title: Bugzilla Bug Edits
description: Bug edit trends.
date: 2025-10-12
---{'title': 'Bugs Edited by Affiliation', 'refresh': 'weekly', 'onIndex': 0}# common fedora commops analytics includes
import pyarrow.dataset as ds
import pyarrow.parquet as pq
import pandas as pd
import pyarrow as pa
import matplotlib.pyplot as plt
import seaborn as sns
import json
from datetime import datetime
from collections import defaultdict
import os
from pyarrow import fs
import pyarrow.dataset as ds
from pathlib import Path# @replace DATA_SOURCES
DATA_SOURCES = {"datagrepper-topics": "/home/jovyan/work/bus2parquet/output_parquets"}
parquet_dir = DATA_SOURCES["datagrepper-topics"]
topic = "org.fedoraproject.prod.bugzilla.bug.update"
cutoff_date = (pd.Timestamp.now().replace(day=1) - pd.DateOffset(months=12)).date()
files = []
for p in Path(f"{parquet_dir}/{topic}").glob("fedora-*.parquet"):
stem = p.stem.replace(f"-{topic}", "")
d = datetime.strptime(stem.split("-")[1], "%Y%m%d").date()
# if d >= cutoff_date and os.path.getsize(p) > 0:
if os.path.getsize(p) > 0:
files.append(str(p))
local_fs = fs.LocalFileSystem()
tables = []
# First pass: collect all schemas
all_fields = {}
for f in files:
try:
tbl = pq.read_table(f)
for name in tbl.schema.names:
all_fields[name] = pa.string() # force everything to string
except Exception as e:
print(f"[WARN] Skipping {f}: {e}")
# Build unified schema
unified_schema = pa.schema([pa.field(name, pa.string()) for name in sorted(all_fields)])
# Second pass: cast each table to unified schema
for f in files:
try:
tbl = pq.read_table(f)
# Cast existing columns to string
casted = {}
for name in tbl.schema.names:
col = tbl[name].cast(pa.string())
casted[name] = col
# Add missing columns as null strings
for name in unified_schema.names:
if name not in casted:
casted[name] = pa.array([None] * len(tbl), type=pa.string())
# Build new table with unified schema
new_tbl = pa.table([casted[name] for name in unified_schema.names], schema=unified_schema)
tables.append(new_tbl)
except Exception as e:
print(f"[WARN] Skipping {f}: {e}")
if tables:
table = pa.concat_tables(tables, promote=True)
df = table.to_pandas()
print(f"Loaded {len(df)} bug update records from {len(tables)} tables.")
else:
print("No valid parquet files found")/opt/conda/lib/python3.11/site-packages/IPython/core/interactiveshell.py:3526: FutureWarning: promote has been superseded by promote_options='default'.
exec(code_obj, self.user_global_ns, self.user_ns)Loaded 78224 bug update records from 1267 tables.# Convert creation time to datetime
df["bug_creation_time"] = pd.to_datetime(df["bug_creation_time"].astype(float), unit="s", errors="coerce")
# Restrict to the last 12 months
cutoff = pd.Timestamp.now() - pd.DateOffset(months=12)
recent = df[df["bug_creation_time"] >= cutoff].copy()
# Create a year-month column
recent["month"] = recent["bug_creation_time"].dt.to_period("M").astype(str)
# Count unique bug_ids by component per month
monthly_counts = (
recent.groupby(["month", "bug_component"])["bug_id"]
.nunique()
.reset_index(name="bug_count")
)
# Rank components by bug count each month
monthly_counts["rank"] = monthly_counts.groupby("month")["bug_count"].rank(method="first", ascending=False)
# Pivot for a heatmap-style view (optional)
pivot = monthly_counts.pivot(index="month", columns="bug_component", values="bug_count").fillna(0)
print("Top 10 components overall in last 12 months:")
print(monthly_counts.groupby("bug_component")["bug_count"].sum().sort_values(ascending=False).head(10))
# Example plot: top 5 components trend
top5 = monthly_counts.groupby("bug_component")["bug_count"].sum().nlargest(5).index
plot_df = monthly_counts[monthly_counts["bug_component"].isin(top5)]
plt.figure(figsize=(12,6))
sns.lineplot(data=plot_df, x="month", y="bug_count", hue="bug_component", marker="o")
plt.title("Top 5 Components by Monthly Unique Bugs (last 12 months)")
plt.ylabel("Bug Count")
plt.xticks(rotation=45)
plt.tight_layout()
plt.show()Top 10 components overall in last 12 months:
bug_component
Package Review 285
kernel 140
selinux-policy 90
chromium 80
radare2 27
distribution 26
anaconda 22
pcp 17
linux-firmware 14
vaultwarden 13
Name: bug_count, dtype: int64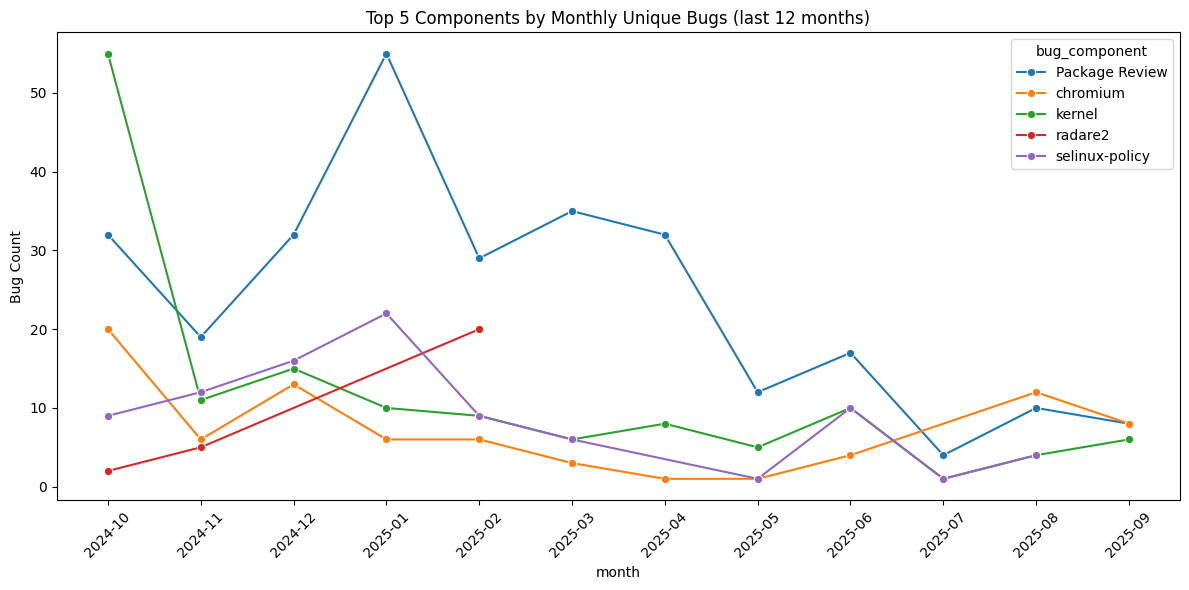
# Make sure all time columns are parsed as datetime from Unix seconds
def to_datetime(col):
    return pd.to_datetime(
        pd.to_numeric(df[col].astype(str), errors="coerce"),
        unit="s", errors="coerce"
    )

df["bug_creation_time"] = to_datetime("bug_creation_time")
df["event_time"] = to_datetime("event_time")
df["bug_cf_last_closed"] = to_datetime("bug_cf_last_closed")# Compute response hours
response["response_hours"] = (
(response["first_followup"] - response["creation_time"]).dt.total_seconds() / 3600
)
# Remove negative and zero values (invalid/no real delay)
response["response_hours"] = response["response_hours"].where(response["response_hours"] > 0)
# Add month of creation
response["month"] = response["creation_time"].dt.to_period("M").astype(str)
# Restrict to last 12 months
cutoff = pd.Timestamp.now() - pd.DateOffset(months=12)
response = response[response["creation_time"] >= cutoff]
# Metrics
metrics = []
for month, group in response.groupby("month"):
valid = group["response_hours"].dropna()
total = len(group)
with_followup = valid.shape[0]
metrics.append({
"month": month,
"avg_hours": valid.mean() if not valid.empty else 0,
"median_hours": valid.median() if not valid.empty else 0,
"bugs_with_followup": with_followup,
"total_bugs": total,
"pct_with_followup": (with_followup / total * 100) if total > 0 else 0
})
metrics_df = pd.DataFrame(metrics).set_index("month").sort_index()
metrics_df = metrics_df.T
plt.figure(figsize=(14,4))
sns.heatmap(
metrics_df,
annot=True,
fmt=".1f",
cmap="YlGnBu",
cbar_kws={"label": "Value"}
)
plt.title("Bug Response Metrics by Month (last 12 months)")
plt.ylabel("Metric")
plt.xlabel("Month")
plt.show()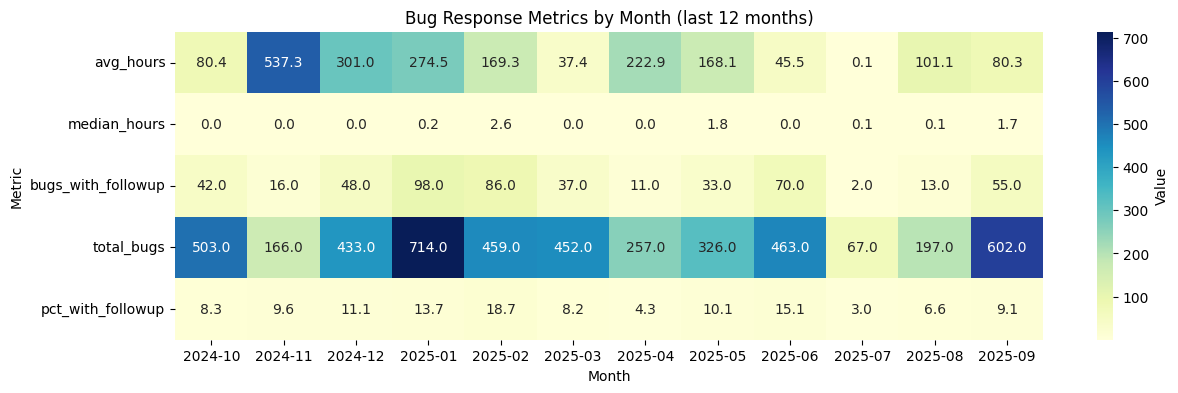
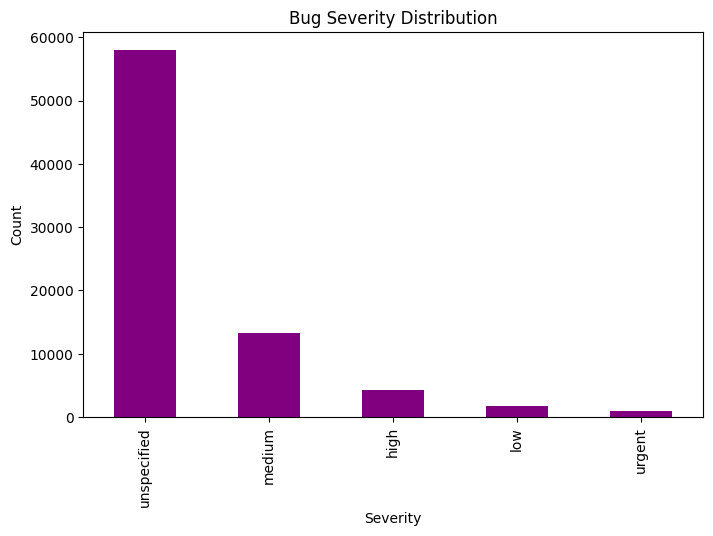
severity_counts = df["bug_severity"].value_counts()

print(severity_counts)

plt.figure(figsize=(8,5))
severity_counts.plot(kind="bar", color="purple")
plt.title("Bug Severity Distribution")
plt.xlabel("Severity")
plt.ylabel("Count")
plt.show()
bug_severity
unspecified 57943
medium 13237
high 4275
low 1785
urgent 984
Name: count, dtype: int64