Show the code
---
title: FAS Account Cohort Analysis
description: FAS Account streaks.
date: 2025-10-12
---
{'title': 'Weekly Distinct Users by Topic (Top 20)', 'refresh': 'weekly'}---
title: FAS Account Cohort Analysis
description: FAS Account streaks.
date: 2025-10-12
---{'title': 'Weekly Distinct Users by Topic (Top 20)', 'refresh': 'weekly'}import os
import glob
from pathlib import Path
from datetime import datetime, timedelta
from collections import defaultdict
import numpy as np
import pandas as pd
import matplotlib.pyplot as plt
import seaborn as sns
import pyarrow as pa
import pyarrow.dataset as ds
import pyarrow.parquet as pq
plt.style.use("seaborn-v0_8")
sns.set_theme(context="notebook", style="whitegrid")# @replace DATA_SOURCES
DATA_SOURCES = {"datagrepper-parse-accounts": "/home/jovyan/work/bus2parquet/output_users"}
parquet_dir = DATA_SOURCES["datagrepper-parse-accounts"]
cutoff_date = (pd.Timestamp.now().replace(day=1) - pd.DateOffset(weeks=52)).date()
files = []
for p in Path(parquet_dir).glob("fedora-*.parquet"):
stem = p.stem.replace("_processed", "")
d = datetime.strptime(stem.split("-")[1], "%Y%m%d").date()
if d >= cutoff_date:
files.append(str(p))
dataset = ds.dataset(files, format="parquet")
chunks = []
for batch in dataset.to_batches(batch_size=50_000):
df = batch.to_pandas()
if "sent_at" not in df.columns or "username" not in df.columns:
continue
df["sent_at"] = pd.to_datetime(df["sent_at"], errors="coerce").dt.floor("s")
chunks.append(df)
combined_df = pd.concat(chunks, ignore_index=True) if chunks else pd.DataFrame()
if not combined_df.empty:
print("Maximum date in data:", combined_df["sent_at"].max().date())
print("Minimum date in data:", combined_df["sent_at"].min().date())
else:
print("No data found in cutoff range")Maximum date in data: 2025-10-02
Minimum date in data: 2024-10-02# Working copy
data = combined_df.copy()
data["month"] = data["sent_at"].dt.to_period("M")
# First and last active month per user
user_activity = data.groupby("username")["month"].agg(["min", "max"]).reset_index()
# Calculate streak length (in months)
user_activity["streak_months"] = (user_activity["max"] - user_activity["min"]).apply(lambda x: x.n)
# Top longest streaks
top_streaks = user_activity.sort_values("streak_months", ascending=False).head(10)
print(top_streaks)
plt.figure(figsize=(10,5))
sns.histplot(user_activity["streak_months"], bins=20, color="teal")
plt.title("Distribution of User Activity Streaks (months)")
plt.xlabel("Consecutive Months Active")
plt.ylabel("Users")
plt.show() username min max \
37417 robert 2024-10 2025-10
7507 bookwar 2024-10 2025-10
37406 robatino@fedoraproject.org 2024-10 2025-10
42826 theforeman-bot 2024-10 2025-10
19566 https://api.github.com/users/droideck 2024-10 2025-10
7492 bonzini 2024-10 2025-10
19564 https://api.github.com/users/dependabot%5Bbot%5D 2024-10 2025-10
37351 rmeggins 2024-10 2025-10
4990 antorres 2024-10 2025-10
19537 https://api.github.com/users/cculianu 2024-10 2025-10
streak_months
37417 12
7507 12
37406 12
42826 12
19566 12
7492 12
19564 12
37351 12
4990 12
19537 12 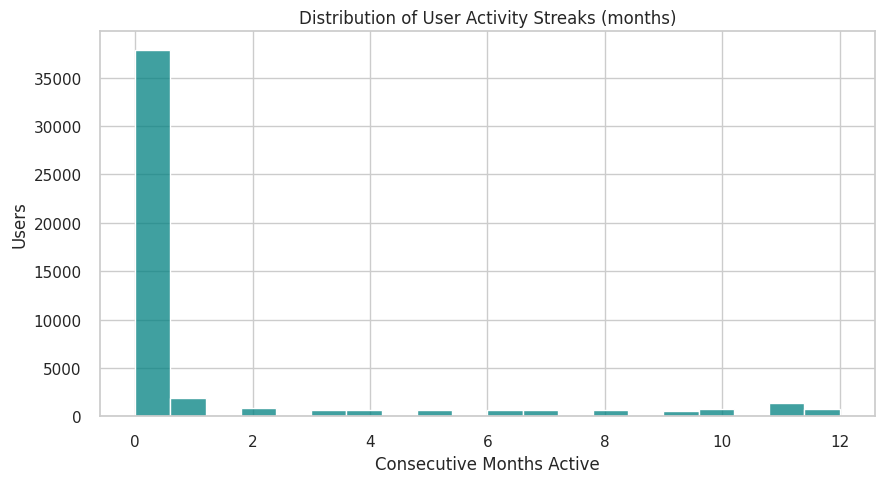
# Working copy
data = combined_df.copy()

# Build user-topic table
user_topic = pd.crosstab(data["username"], data["topic"])

# Topic overlap = shared users between topics
topic_overlap = user_topic.T.dot(user_topic)
np.fill_diagonal(topic_overlap.values, 0)  # remove self counts

plt.figure(figsize=(10,8))
sns.heatmap(topic_overlap, cmap="YlGnBu", annot=False)
plt.title("Topic Overlap by Shared Users")
plt.xlabel("Topic")
plt.ylabel("Topic")
plt.show()# Working copy
data = combined_df.copy()
# Count distinct topics per user
topics_per_user = data.groupby("username")["topic"].nunique()
plt.figure(figsize=(10,5))
sns.histplot(topics_per_user, bins=20, color="purple", log_scale=(False, True))
plt.title("Distribution of Topics per User")
plt.xlabel("Number of Topics")
plt.ylabel("Number of Users (log scale)")
plt.show()
print("Median topics per user:", topics_per_user.median())
print("Users in multiple topics:", (topics_per_user > 1).sum())# Working copy
data = combined_df.copy()
# Users per topic
topic_users = data.groupby("topic")["username"].nunique()
# Repeat users = users appearing in more than 1 topic
multi_topic_users = data.groupby("username")["topic"].nunique()
repeat_users = set(multi_topic_users[multi_topic_users > 1].index)
topic_repeat = data[data["username"].isin(repeat_users)].groupby("topic")["username"].nunique()
core_ratio = (topic_repeat / topic_users).fillna(0).sort_values(ascending=False)
plt.figure(figsize=(10,5))
core_ratio.plot(kind="bar", color="darkgreen")
plt.title("Core vs Peripheral Topics (Ratio of Repeat Users)")
plt.ylabel("Proportion of Users in >1 Topic")
plt.xlabel("Topic")
plt.tight_layout()
plt.show()import networkx as nx
# Working copy
data = combined_df.copy()
# Build bipartite graph (users ↔ topics)
G = nx.Graph()
for _, row in data.iterrows():
G.add_edge(row["username"], row["topic"])
# Project onto topics (shared users)
topic_graph = nx.bipartite.weighted_projected_graph(G, data["topic"].unique())
# Largest connected component
largest_cc = max(nx.connected_components(topic_graph), key=len)
H = topic_graph.subgraph(largest_cc)
plt.figure(figsize=(12,8))
pos = nx.spring_layout(H, k=0.3)
nx.draw_networkx_nodes(H, pos, node_size=300, node_color="skyblue")
nx.draw_networkx_edges(H, pos, alpha=0.3)
nx.draw_networkx_labels(H, pos, font_size=8)
plt.title("Communities-of-Practice (Topic Graph by Shared Users)")
plt.axis("off")
plt.show()# Working copy
data = combined_df.copy()
data["month"] = data["sent_at"].dt.to_period("M")
# First month per user
first_month = data.groupby("username")["month"].min()
# Tag new users
data["is_new"] = data["username"].map(lambda u: data.loc[data["username"]==u, "month"].min())
# Count new users per topic per month
new_users = (
data.drop_duplicates(["username","topic"])
.groupby(["topic","month"])["username"]
.nunique()
.unstack(fill_value=0)
)
# Keep top topics
top_topics = new_users.sum(axis=1).sort_values(ascending=False).head(8).index
new_users = new_users.loc[top_topics]
plt.figure(figsize=(12,6))
sns.heatmap(new_users, cmap="OrRd", annot=True, fmt="d")
plt.title("Onboarding Velocity: New Users per Topic per Month")
plt.xlabel("Month")
plt.ylabel("Topic")
plt.show()